In Part 1 of our discussion of the importance of TQM to the injection molding process, we introduced George Popov, our Quality Supervisor, and provided you with a behind-the-scenes look at what George and the Ferriot Quality Team are doing to implement and improve TQM on a daily basis.
In Part 2, George and I discuss a new technology acquisition, the AICON smartScan Structured Blue Light Scanner, and how it is helping Ferriot meet and exceed quality goals.

Liz: Tell me about this new scanner. How long have you had the scanner in-house and how are you using it?
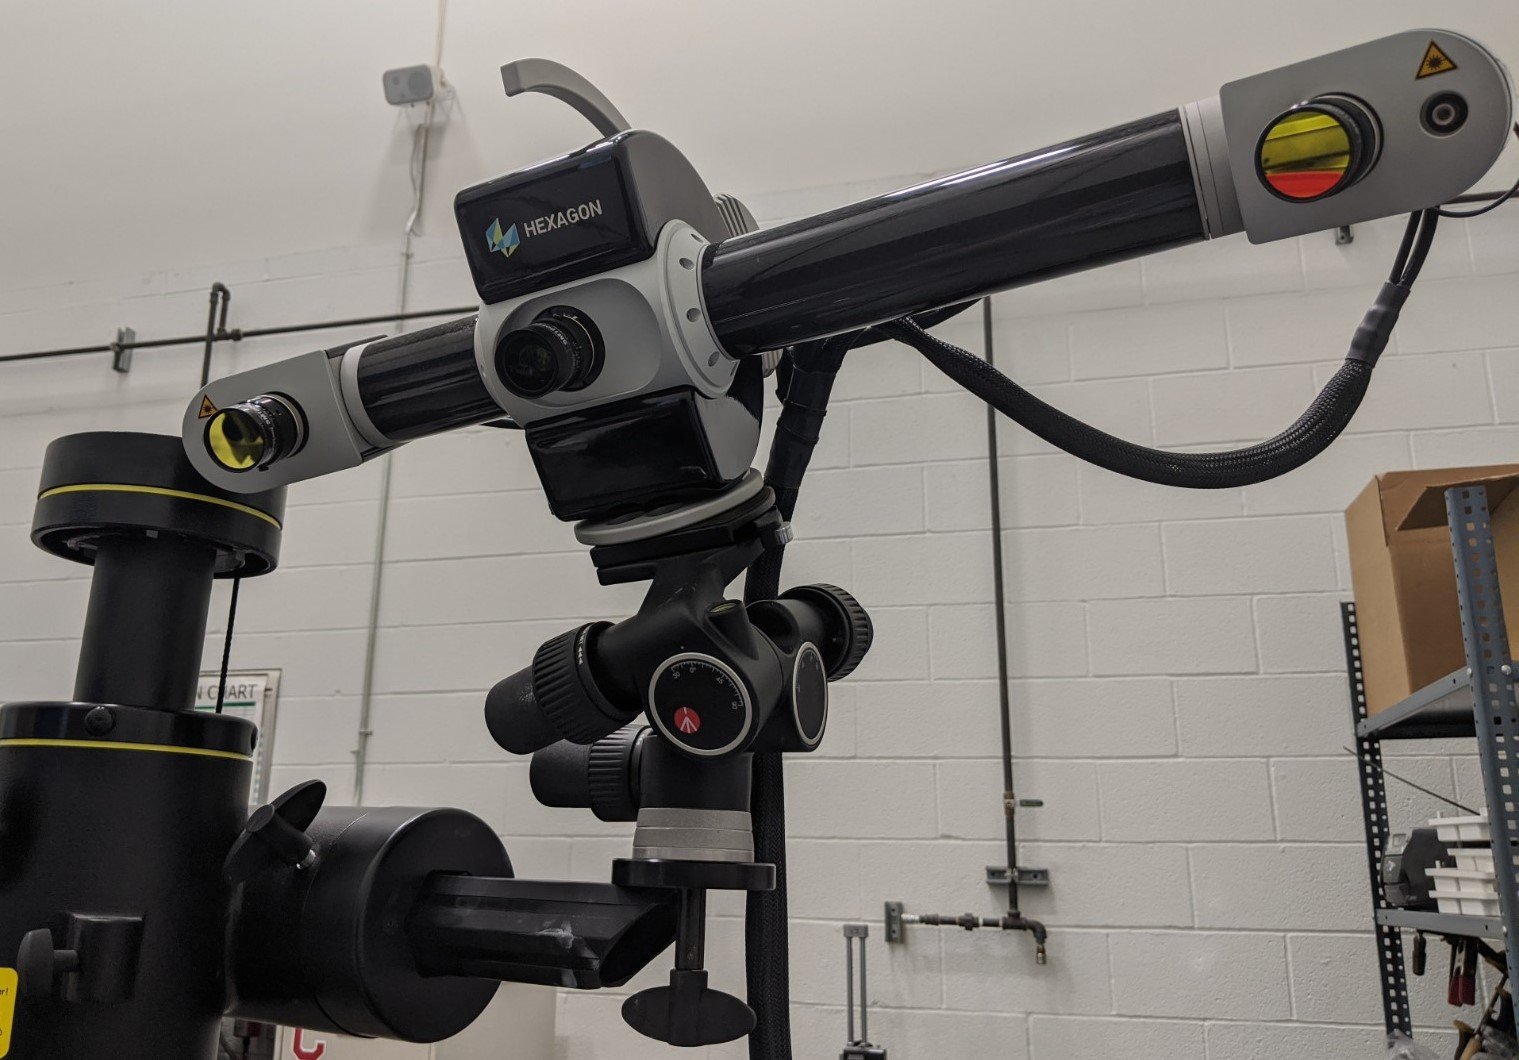
George: We’ve been utilizing the new scanner for about 18 months. The AICON smartScan is a new state-of-the-art piece of metrology equipment that helps us to accelerate the injection molded part development process. It’s a blue-light scanner, that works in conjunction with PolyWorks inspection software. It enables us to scan physical parts into 3D images that can then be overlaid to the CAD model for that part and inspected very thoroughly.
One of the greatest benefits this provides is the color map comparison feature, which provides instantaneous visual results and allows us to see what is going on with the part before ever taking a single measurement. The color map provides a real indication of the distance between the actual part versus the CAD nominal surface. This is of great benefit to our customers, because it helps quickly solve any issues they are experiencing in the very early stages of part development and verification during the approval process.
Liz: How has that scanner helped the engineering and quality teams do their jobs better?
George: The scanner has the most direct impact on our quality department as a whole, but it’s especially valuable to the project engineers because they’re able to look at real-time data, visibly seeing critical details of a part that has been scanned. Right away, they’re able to tell where the problem points are going to be when we mold these parts in-house.
Most of the time we will actually get samples along with a transferred mold tooling. In fact, a lot of the molds we have are transferred tools, so we frequently get parts from different countries all over the world. We scan them and can see where they’re at quality-wise before we actually mold parts with them—so we have something to compare to. If necessary, we can make quality improvements to the mold that’s been transferred to us, so t’s been very helpful in that aspect.
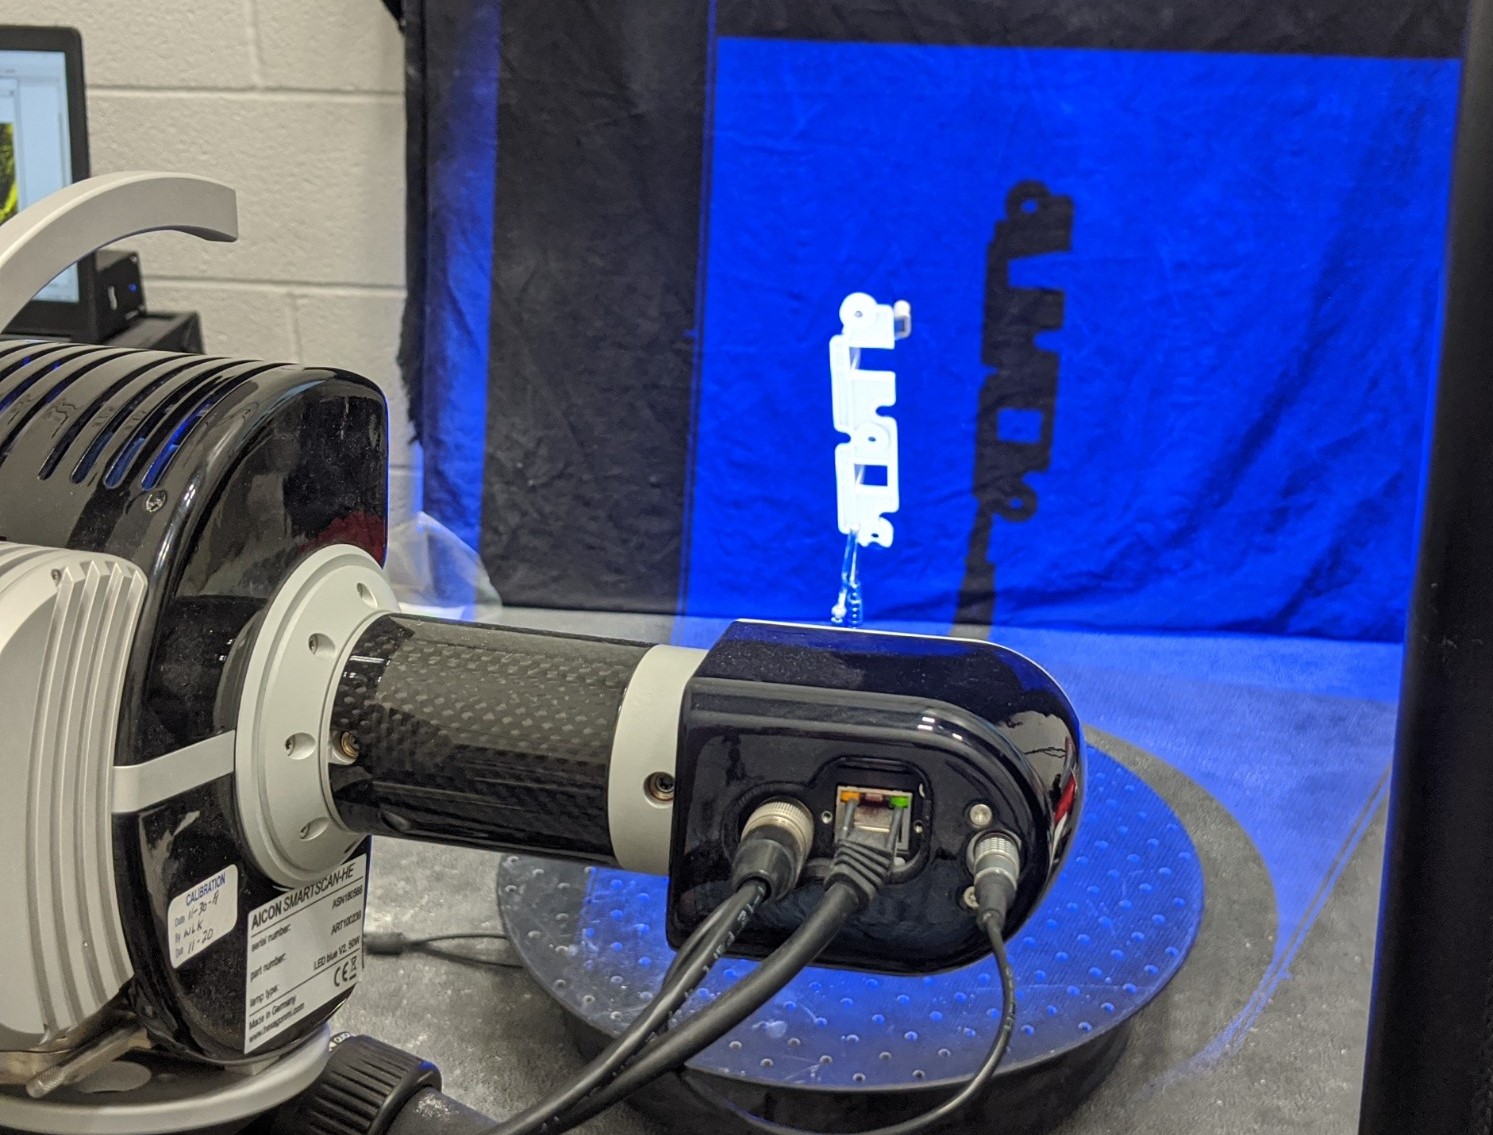
Ferriot’s AiCON smartScan scanning an injection molded part using blue light scanning technology. Blue light 3D scanners offer better precision, accuracy, and higher quality outputs than white light scanners, laser scanners, and CMM.
Liz: I can imagine that saves a lot of time and aggravation! You told me that this scanner replaces about 80% of what used to be done with the Coordinate Measuring Machine (CMM). What is still being done with the CMM?
George: The things that are being done with the CMM are only the parts that we are not able to scan. What I mean by that is, with the scanner, what you see is what you get. If the cameras can see the features that you’re trying to attain, then it will be able to measure them, or it will be able to capture an image.
However, if the cameras cannot see a feature such as deep channels or bosses, it does not do well with that because it can only scan so deep. Then we would put those parts on the CMM. In fact, the scanner and CMM can work together. You can do part of a program on the scanner, and whatever you can’t get on the scanner, you can do on the CMM, which also saves us quite a bit of time.
So yes, we’re doing much more on the scanner. That is our main device for gathering data now. Our CMM is pretty much our secondary or backup machine. We still utilize CMM. Actually, there are parts that we do on the CMM for programming purposes because it’s easier. Between the scanner and CMM, we have the flexibility to pick which is best for the project.
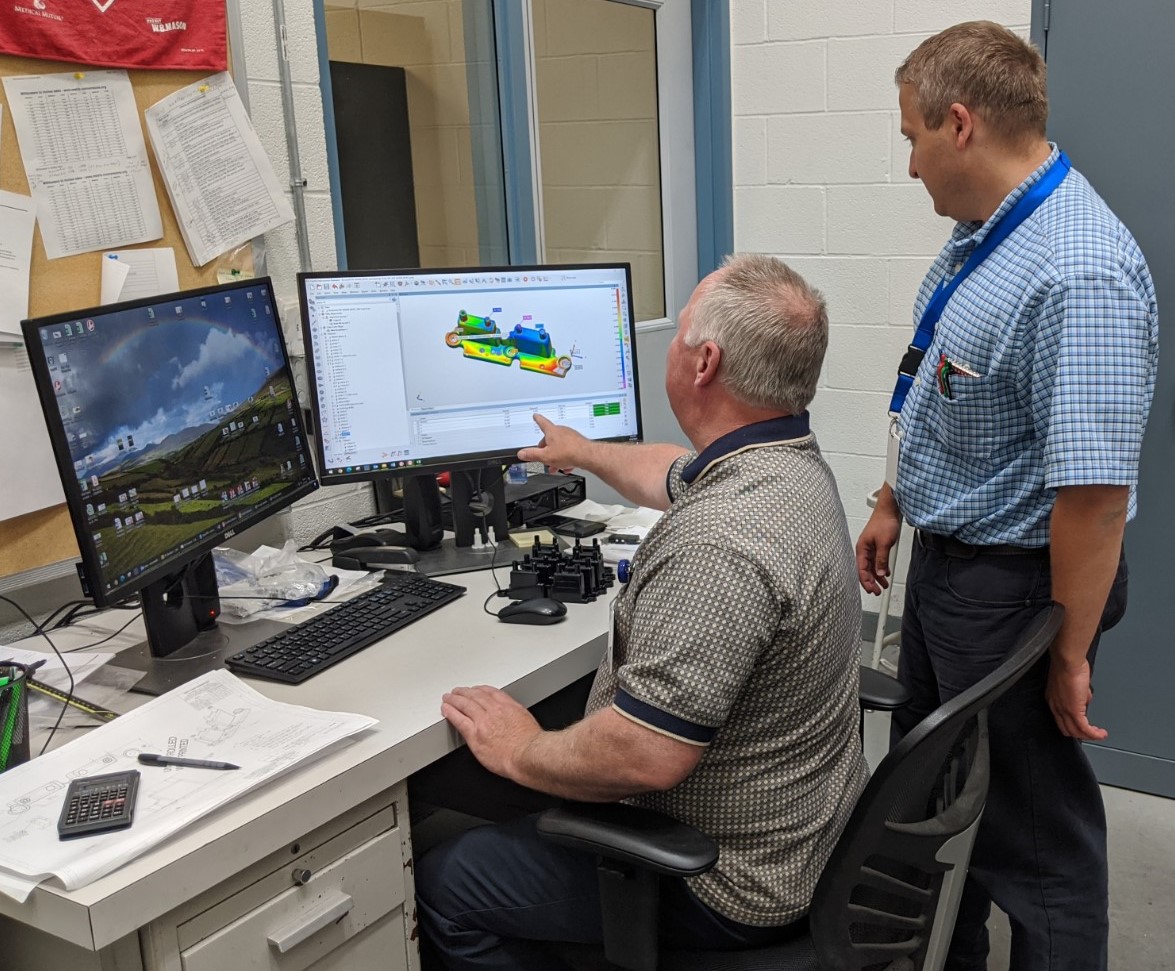
George Popov, Quality Supervisor and Walt Kravetz, Quality Technician, reviewing smartScan data in PolyWorks Inspector software.
Liz: Any interesting quality success stories since you’ve been at Ferriot?
George: One of the first customers we started doing scanning work for saw the data, and they came in and wanted to talk to us about what they thought was inconsistent data. They thought, they better make sure this scanner works because it’s a new system and the data looks questionable.
What we were able to prove is how warped their parts were, and how it wasn’t the scanner, it was actually the parts themselves that were so different. When comparing from part to part, they varied so much. I was able to show them that with the PolyWorks software that works in conjunction with our scanner. We could easily zone in on specific areas with which they were having concerns, and show them why they were having problems with them.
We were able to overlay the scan model over the CAD model and apply a color map. By manipulating the scale range for that color map, you can have a tighter tolerance to see where parts are out of spec, and how closely the scan model correlates to the CAD model.
By comparing the new scanner data and addressing their concerns, we were able to prove to them that the PolyWorks software is more than capable of giving them the precise, accurate data they needed. They were very satisfied with what we showed them, and their confidence level in our capabilities were established. They walked away satisfied with what we were able to do, and they felt comfortable that the data we gave them is good data. The fact that they can see the areas of concern without us even taking measurements was a huge deal for them.
Liz: Tell us a little more about the PolyWorks software and the value that it brings to the process as well.
George: Once scanning is completed; a mesh is created and then an STL file is used to inspect against a 3D CAD model in PolyWorks software…
Liz: …And what is the STL file and mesh that’s created?
George: Well, STL is short “Standard Triangle Language” and “Standard Tessellation Language.” STL (or STereoLithography) is an openly documented file format for describing the surface of an object as a triangular mesh, that is, as a representation of a 3-dimensional surface in triangular facets. We use the STL file with PolyWorks Inspector.
Liz: Ok. So, then the STL file is used with PolyWorks in what ways?
George: PolyWorks Inspector is a universal 3D dimensional analysis and quality control software solution. By using it with portable metrology devices like our SmartScan, we control tool and/or part dimensions, diagnose and prevent manufacturing and assembly issues, guide assembly building through real-time measurements, and oversee the quality of assembled products. The scanning software allows for smoothing and filling in of areas not scanned, based on triangulation and geometry of surrounding areas attained by scanning.
PolyWorks Reviewer is an easy-to-use software application that can be utilized by Ferriot’s cross-functional teams or even our customers in order to visually assess the injection molded part and any areas of concern. Put simply, Reviewer enables manufacturing specialists to dig deeper into the measurement database to analyze any dimensional issues highlighted by a metrology specialist. In Reviewer, controls can be searched, sorted, or filtered in the user-friendly Control Review Interface.
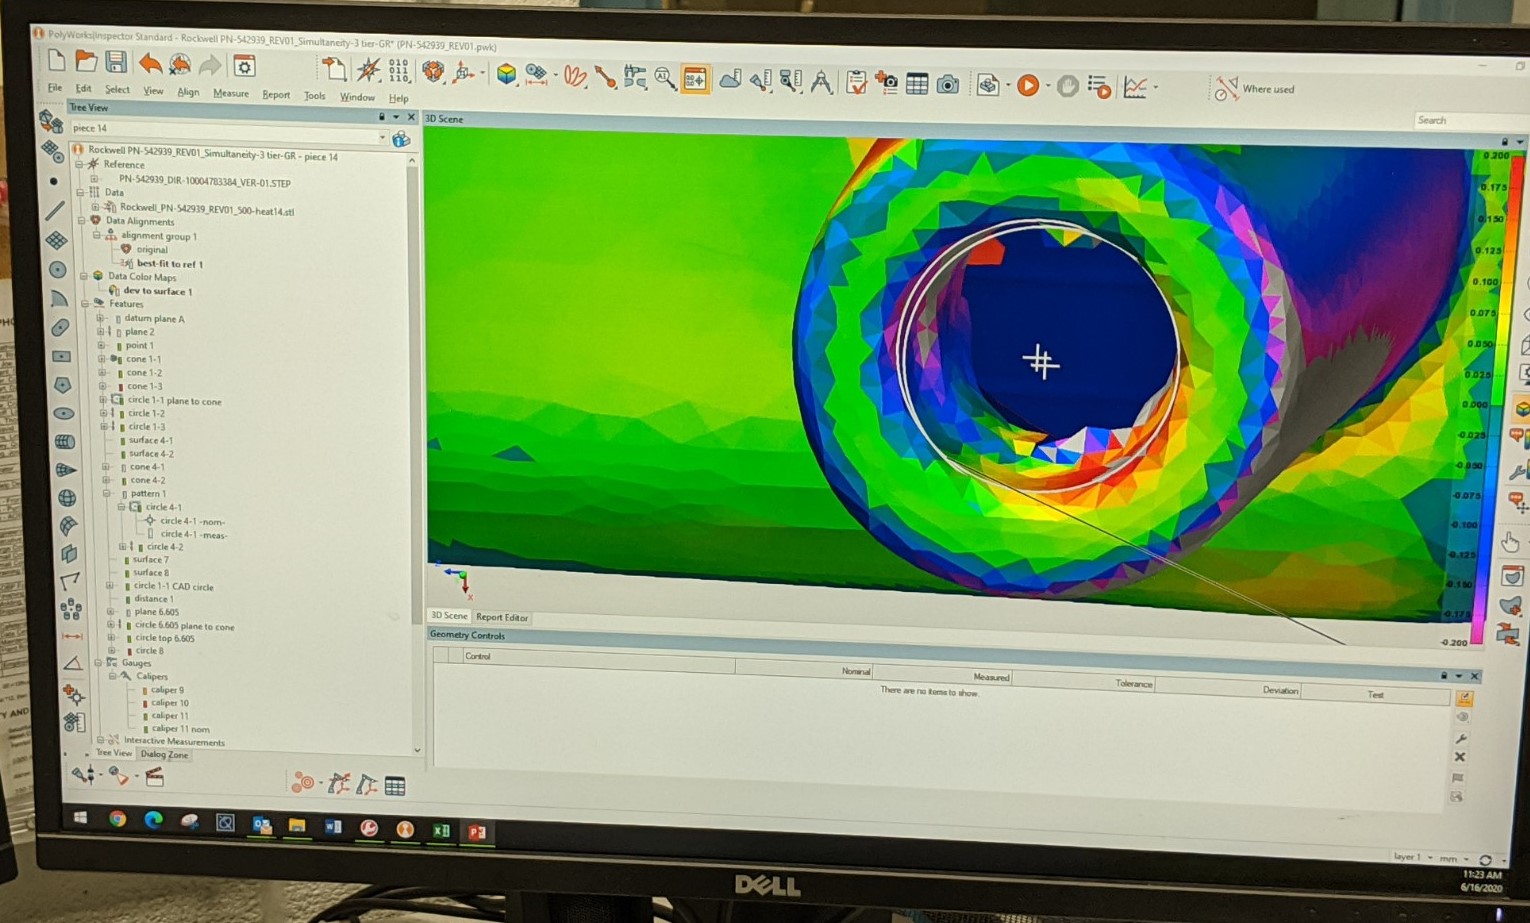
View of AICON smartScan data in PolyWorks Inspector universal 3D dimensional analysis and quality control software.
Liz: Previously, we talked about SPC and graphs. What is SPC and how is it used?
George: Statistical process control.
Liz: And you were saying that we could graph now, and apparently, we couldn’t before. Is that correct?
George: Correct. It’s a huge plus, and I think more and more companies are going towards SPC because it really gives us the tools to be able to control processes out on the production floor. That’s what we’re really geared towards—controlling processes. You can see on the graph when things get out of control, then you can make the call, “Hey, something’s going on here, we need to get this thing back into control.” And then you can follow the graph and see your trends. Trend charting is huge and adds a great deal of value.
That’s actually another thing I’m working on with the inspectors: I’m having them look at their trend charts to see how things are measuring on a day-to-day basis, and at production run after production run. As a result, we have that data now. The big deal about having this electronic database is being able to chart everything, being able to look at what they’re inspecting. The whole visual aspect is very key. That’s a big deal for us, and for our customers.
Liz: One last question. As quality supervisor, how would you describe the Ferriot advantage to a potential new client?
George: Well, that’s a good question. I would say the Ferriot Advantage is that we are moving TQM in a direction of total customer satisfaction—from their supply chain and procurement people to the design engineers and quality control manager. Part of that is acquiring state of the art equipment that gives our customers, not just a warm and fuzzy feeling, but absolute confidence that the data that we provide them is accurate and precise.
Why? Because they’re be able to see everything. It’s a very visual system. And I don’t know about you, but when I’m looking at a big spreadsheet of numbers, it’s easy to get lost quickly. But when I’m looking at a visual map, something easy to interpret with the eyes, then I don’t need to guess where things were measured. At what point was this measured? How many points were taken to create this feature? Everything is visual. It’s right there in front of me. And it gives a very quick indication of the overall quality of the customer parts.
In turn, that allows us to make quick decisions on how to proceed. If the part is good, we can see that right away. And if not—if there needs to be tool modification—we can make adjustments. We can do it quickly. No surprises. We don’t have to sit down over spreadsheet after spreadsheet and try to make an educated guess on which way to go, because that’s very costly. In the end, it comes down to saving time, cost, and quality, all of which are reflected on the bottom line.
We not only want to get things out in a timely manner, but in an efficient manner. We don’t want to just read through things and give data that we’re not sure of. When we can put a color map and data side by side and it just jives like that, it gives everyone a good feeling and confidence that the support we’re going to give is going to be second to none.
- Importance of TQM to Injection Molding Projects – Part 1 [Interview]
- Does Your Manufacturer Have a Product Quality Audit in Place?
- Three Ways a Full-Service Contract Manufacturer Adds Value
- Total Quality Management Services
- Request a Quality Audit